ORtg
34.3
11th event percentileEstimated points produced per 100 possessions.
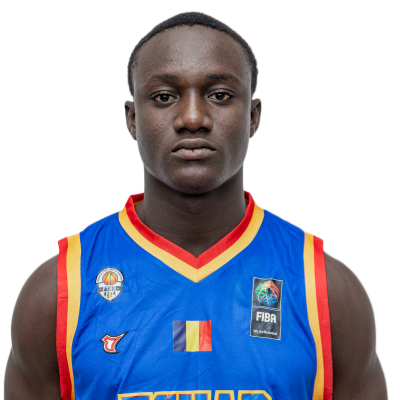
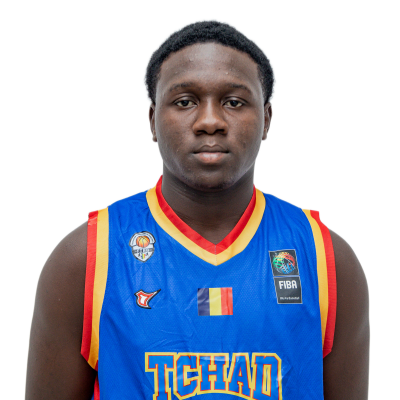
CHA · b. 2008
Latest event year on file: 2026FIBA U18 AfroBasket
Connect your athlete profile through an ownership review.
//15_second_scouting_read
data-led profileCreation and Defensive activity are the clearest relative production signals in this event.
1.8 APGCreation · 77th event percentile
1.2 stocksDefensive activity · 44th event percentile
Performance
1 rated event
Published event intelligence
Film
No public film
Add film to show your play in context
Scouting
No final report
No human evaluation on file
Competition
1 event
Event context and history available
01
//performance_intelligence
Event-scoped HESI impact, role, sample strength, team context, and the questions that still need film verification.
//athlete_dossier · event_intelligence
Event-scoped production and two-way impact. This is performance data—not a scout evaluation or universal OVR.
FIBA U18 AfroBasket2026
Rank #138 of 138 · Established
HESI
0.7
Event performance
1st event percentile
PI
12.1
Prospect index
1st event percentile
ORtg
34.3
Points / 100 poss.
11th event percentile
DRtg
87.8
Lower is better
25th event percentile
NRtg
-53.4
Two-way margin
8th event percentile
Offensive evidence
ORtg 34.3 · 11th event percentile
Defensive evidence
DRtg 87.8 · Stop% 53.4% · Team DRtg 84.8
Sample context
6 games · 135 minutes · 69% weight
//statistical_read · not_a_scout_grade
Creation and Defensive activity are the clearest relative production signals in this event.
Creation
Defensive activity
Questions for film
Can the scoring load hold as defensive attention and role responsibility increase?
Which shot types and advantages are driving the efficiency profile?
//impact_fingerprint
HESI performance
0.7
1st event percentile
Prospect index
12.1
1st event percentile
Offensive efficiency
34.3
11th event percentile
Defensive efficiency
87.8
25th event percentile
Two-way margin
-53.4
8th event percentile
Stop percentage
53.4%
29th event percentile
//role_and_production
Scoring load
0.5 PPG
8th event percentile
Creation
1.8 APG
77th event percentile
Rebounding
2.5 RPG
33rd event percentile
Defensive activity
1.2 stocks
44th event percentile
Scoring efficiency
13.9% TS
9th event percentile
//reading_guide
HESI
Stabilized event performance
A 0–100 event-relative rank of stabilized Net Rating. Smaller samples are pulled toward neutral before players are ordered.
PI
Prospect index
80% HESI performance, 12% competition context and 8% age context. It remains an event-scoped prospect index—not a universal ranking.
ORtg · DRtg · NRtg
Dean Oliver impact
Estimated points created and allowed per 100 possessions, plus their net difference. Lower DRtg is better.
Percentiles compare this athlete only with the published, trust-gated player pool from this event. Missing evidence stays blank and is never converted to zero.
The strongest patterns in this event sample, adjusted to the competition when event percentiles are available.
//automated_interpretation · dean_oliver + event_stats
HESI performance sits at the 1st event percentile. The Dean Oliver profile estimates 34.3 ORtg and 87.8 DRtg, producing a -53.4 Net Rating. The clearest relative strength is creation. The lowest relative areas are two-way margin, scoring load, and scoring efficiency.
Creation
1.8 APG
Assist production suggests a meaningful event-relative creation role; film must still separate advantage creation from connective passing.
Two-way margin
-53.4 NRtg
The current gap between estimated offensive and defensive efficiency trails much of this event pool.
Scoring load
0.5 PPG
Scoring volume is a lower relative part of this event profile.
Scoring efficiency
13.9% TS
True shooting efficiency is a lower relative area in the current event sample.
//complete_statistical_profile
Percentile labels compare the player with the same published event pool. Context-only values are shown without inventing a rank.
Efficiency, scoring load, shooting shape and creation.
ORtg
34.3
11th event percentileEstimated points produced per 100 possessions.
Points
0.5 PPG
8th event percentileScoring volume per game.
True shooting
13.9%
9th event percentileScoring efficiency including twos, threes and free throws.
Effective FG
11.1%
12th event percentileField-goal efficiency with extra credit for made threes.
Field goals
11.1%
12th event percentileOverall field-goal percentage.
Three-point shooting
0.0%
context0.2 attempts per game
Free throws
25.0%
10th event percentileFree-throw conversion in this event.
Floor%
16.5%
9th event percentileEstimated share of possessions producing at least one point.
Assists
1.8 APG
77th event percentileRecorded passing production per game.
Estimated defensive efficiency, stops and recorded activity.
DRtg
87.8
25th event percentileEstimated points allowed per 100 possessions; lower is better.
Team DRtg
84.8
contextTeam defensive baseline used by the Dean Oliver estimate.
Defensive lift
-2.9
41st event percentilePlayer DRtg is higher than the team baseline.
Stop%
53.4%
29th event percentileEstimated share of defensive possessions ended through the player.
Recorded activity
1.2 STL+BLK
44th event percentileSteals plus blocks per game; it does not capture positioning or containment.
Estimated stops
29.6
contextDean Oliver estimated defensive stops across the event sample.
Net impact, stabilized performance and supporting production.
Net Rating
-53.4
8th event percentileRaw ORtg minus DRtg.
Stabilized NRtg
-38.6
1st event percentileNet Rating pulled toward the event median according to sample size.
HESI performance
0.7
1st event percentileEvent-relative rank of stabilized two-way performance.
Prospect index
12.1
1st event percentileHESI performance with competition and age context.
PIE
-1.7%
16th event percentileEstimated share of positive game events while on the floor.
Rebounds
2.5 RPG
33rd event percentileTotal rebounding production per game.
How much evidence supports the estimates shown above.
Games
6
contextPublished games included in this event line.
Minutes
134.9
context22.5 minutes per game.
Sample weight
69.2%
contextHow strongly the model trusts raw Net Rating versus the event median.
Confidence
Established
contextModel confidence based on available games and minutes.
Event rank
#138
contextAmong 138 published players.
Team possessions
492.7
contextEstimated team possessions supporting the defensive context.
model_limits
02
//competition_evidence
Where the production happened, how strong the event pool was, and every published competition supporting the profile.
Primary competition is the highest-stature event. Best ranking evidence is the strongest event-relative finish — they may come from different events.
//primary_competition · highest_stature
FIBA U18 AfroBasket
Continental · 2026
6
GP
0.5
PPG
2.5
RPG
1.8
APG
#138
RANK
Published competitions, strongest first. Open the statistical record for the complete event line.
FIBA U18 AfroBasket
Continental · 2026
6
GP
0.5
PPG
2.5
RPG
1.8
APG
FIBA U18 AfroBasket 2026 · 138 ranked players
//current_rank
#138
of 138 ranked
//end_of_the_board
No one ranks below this player in the event.
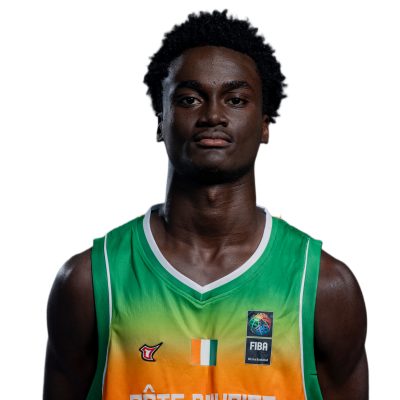 #1
Shooting Guard · Côte d'Ivoire
17.5 PPG 4.5 RPG 1.3 APG
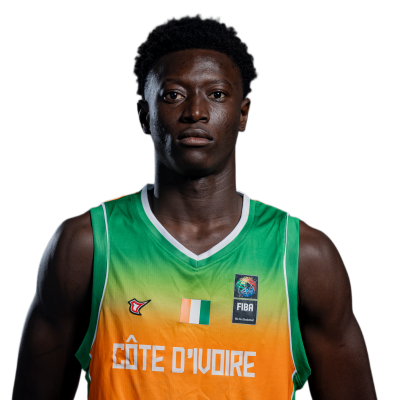 #2
Côte d'Ivoire
7.7 PPG 4.0 RPG 1.0 APG
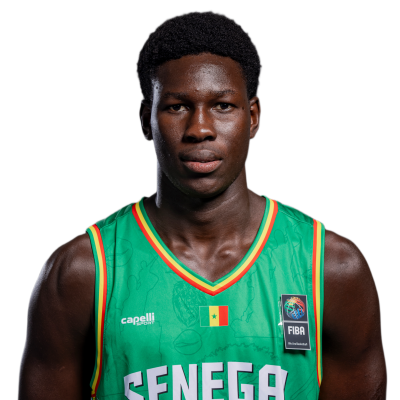 #3
Center · Senegal
11.3 PPG 10.0 RPG 1.5 APG
 #136
03
//statistical_record
Complete event-specific production lines for auditing the read without flattening different competitions together.
FIBA U18 AfroBasket · 2026 — scoped to this competition pool.
6
GP
0.5
PPG
2.5
RPG
1.8
APG
1.2
SPG
0.0
BPG
0%
3P%
14%
TS%
Each line is scoped to one competition pool — not comparable across events.
FIBA U18 AfroBasket2026
6 GP · event rank #138
//quick_read
0.5
PPG
2.5
RPG
1.8
APG
2.2
TOV/G
0.0
3PM/G
14%
TS%
//event_fingerprint
Scoring
0.5
P8
Playmaking
1.8
P77
Rebounding
2.5
P33
True shooting
14%
P9
Two-way impact
-53.4
P8
Stops
53%
P29
//shooting_profile
FG
Field goals
11%
1 made / 9 attempts
3PT
Three-pointers
0%
0 made / 1 attempts
FT
Free throws
25%
1 made / 4 attempts
Shot selection
11% of attempts from three
//complete_box_score
scoring
3
PTS
0.5 / game
1–9
FGM–FGA
0–1
3PM–3PA
1–4
FTM–FTA
creation
11
AST
1.8 / game
13
TOV
2.2 / game
0.85×
AST:TOV
9
FD
rebounding
15
REB
2.5 / game
3
OREB
12
DREB
2.5
REB/G
defense
7
STL
1.2 / game
0
BLK
0.0 / game
18
PF
7
STL+BLK
1.2 / game
//hesi_and_dean_oliver
0.7
HESI
12.1
PI
34.3
ORtg
87.8
DRtg
-53.4
NRtg
-38.6
Stable NRtg
53%
Stop%
16%
Floor%
11%
eFG%
-2%
PIE
84.8
Team DRtg
-2.9
Def. lift
04
//player_context
Biography, achievements, public identity, and profile ownership provide context without entering the performance rating.
Background supplied by the athlete or verified profile source. Performance ratings remain separate from biography and achievements.
This profile was auto-generated from public tournament data. Claim it to connect your highlight reel, get scouted, and own your story on HESI.
data_source · fiba — statistics retain their original event attribution.